Data Analysis
Restaurants Count in Las Vegas
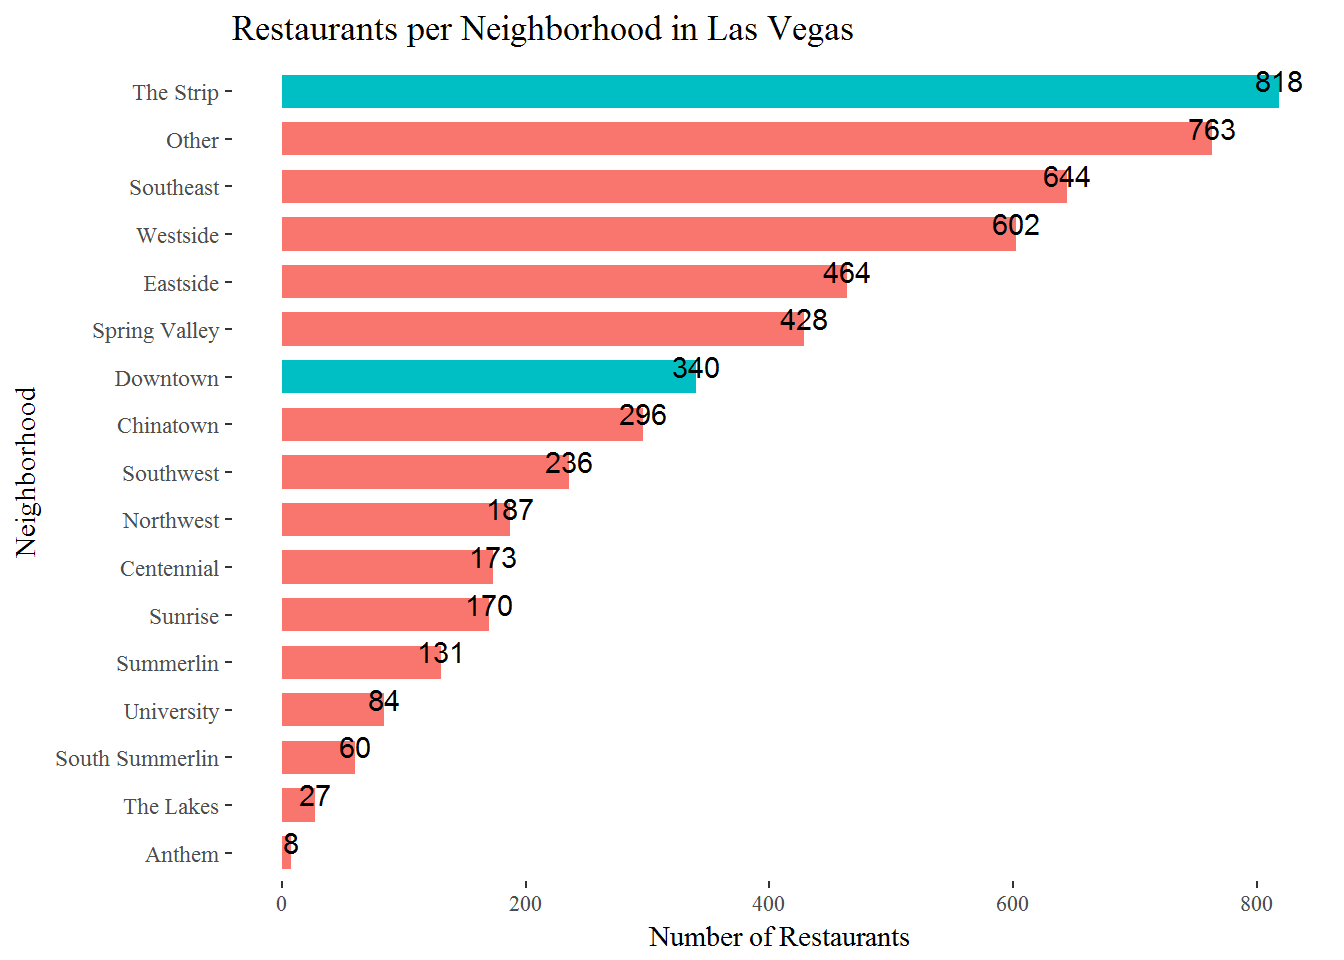
We draw a plot showing a total count of restaurants by neighborhood level in Las Vegas. As a result, we found the Strip has the most restaurants across all neighborhoods in Las Vegas.
- Downtown: total 340 restaurants
- The Strip: total 818 restaurants
Proportion of Ratings by Neighborhood
We compared the proportion of Restaurants’ star ratings by neighborhood-level in Las Vegas. Star ratings are in scale of 1 to 5 and rated by Yelp Reviewers (i.e., consumers of restaurants).
Restaurant rating distribution is varied by each neighborhood in Las Vegas. However, distribution of restaurant ratings in two selected neighborhoods, The Strip and Downtown are somewhat similar. Downtown has average restaurant rate of 3.65 out of 5.00; The Strip has average restaurant rate of 3.32 out of 5.00. Also, Downtown has a higher proportion for restaurants rated as star 4 or above, comparing to the Strip, which mainly comprises of star 3-rated restaurants.
Price Range Proportion by Neighborhood
Review Counts per Neighborhood


Attribute Analysis
We checked restaurant distribution by cuisine and impacts of selected attributes on restaurants’ price and rating range in Downtown and the Strip. Price range scale is from 1 to 4; rating range scale is from 1 to 5. We used restaurant proportion in percentage, instead of restaurant count for better comparsion, as the Strip’s restaurant total count is much higher than Downtown’s total restaurant count.
Restaurant Distribution by Cuisine in Las Vegas

- The strip has more American and Asian cuisine restaurants.
- Downtown has more Mexican and European cuisine restaurants.
Impacts of Cuisine Cateogory


Impacts of Alcohol Attribute


- The Strip region’s restaurants are high-rated if they sell alcohol drinks.
- Downtown restaurants slightly follow this trend, too, but boozy option is more popular in the Strip.
Impacts of Ambience Attribute


- Overall similar trend of ratings per ambience, but restaurant customers in the Strip prefers “Classy” and “Upscale” restaurants a bit more.
- The Strip restaurants’ price range are higher on average.
- Also, restaurants in the Strip are categorized with more diversified ambience attributes.
Impacts of Dress Code Attribute


- Consumers from both neighborhoods prefer restaurants allow them to dress up.
- Some of the Strip restaurants even have strict “formal” dress code; their price level is high, but they satisfy the consumers, according to rate rating.
Impacts of Kid-friendliness Attribute


- The Strip consumers are not favorable to restaurants good for kids.
Impacts of Meal Type Attribute


- Consumers in Downtown are sweet tooths.
- The most preferred meal type in Downtown is lunch; the most preferred meal types in the Strip is lunch and dinner.
Impacts of Noise Level Attribute


- Both consumers in Downtown and The Strip prefer quiet noise level of restaurants, according to high restaurant rating.
- However, eating at a quiet restaurant is more expensive in The Strip.
- Restaurants with loud or very loud noise level are expensive in Downtown, despite consumers’ least favor toward them. Quiet restaurants are not only preferred by consumers, but also cheaper than loud restaurants in Downtown.